Promoting Smart Energy Consumption
Background:
In the recent series of hurricanes, wildfires, and other natural disasters, it is becoming more apparent that the severity of natural disasters are causing damages that have never been seen before due to global warming. Climate change is strongly linked to the rising global carbon emissions due to fossil fuels since the 1900s. Whether or not you believe this connection between climate change and carbon emissions, we can all agree that burning less fossil fuels can foster safer air and environments.
Building energy consumption is a major source of carbon emission due to fossil fuels at 40%. The conventional system of building energy management is inefficient and outdated with users notified of their energy usage on a monthly frequency. Sensors and smart meters have recently enabled real-time information of energy consumption as well as a platform to potentially transform human energy consumption behavior. A more conscious approach to energy consumption will not only save us money and resources, but also create a more sustainable planet. Advances in green building technology is crucial to safer and more sustainable development.
Data:
I would like to acknowledge Pecan Street for granting me access to their Dataport, which I used for this project. Pecan Street uses a smartgrid system, an electricity supply network that uses newly developed technologies, to detect and communicate changes in the use of electricity, gas, and water. The Dataport contains a large database of energy and water consumption stored on a PostgreSQL platform.

For this project, I focused solely on electricity consumption, which was measured in units of kWh at the hourly level. I was able to access the data from the PostgreSQL database using SQLalchemy. I also utilized other information in Pecan Street’s rich database, such as energy consumption of specific appliances and weather data at the hourly level.
For the purpose of consistency and understanding the effects of different models, I built models from energy consumption data of Building 545. This is a typical single-family home found in Pecan Street’s Dataport.
Time Series Analysis:
Time series data are indexed in successive equally spaced points in time. They are typically broken up into three main components: seasonal, trend, and white noise. A seasonal pattern exists when a series is influenced by seasonal factors at a fixed time period. A trend exists when there is a long-term increase or decrease in the data. White noise is the remainder of the time series, which describes the randomness in the dataset with no correlation with the time index.
The three components can be used to build time series models to forecast energy consumption and detect anomalies. A deep understanding of factors that affect consumers’ energy consumption behavior can lead to significant advances in the green building revolution.
Baseline Models
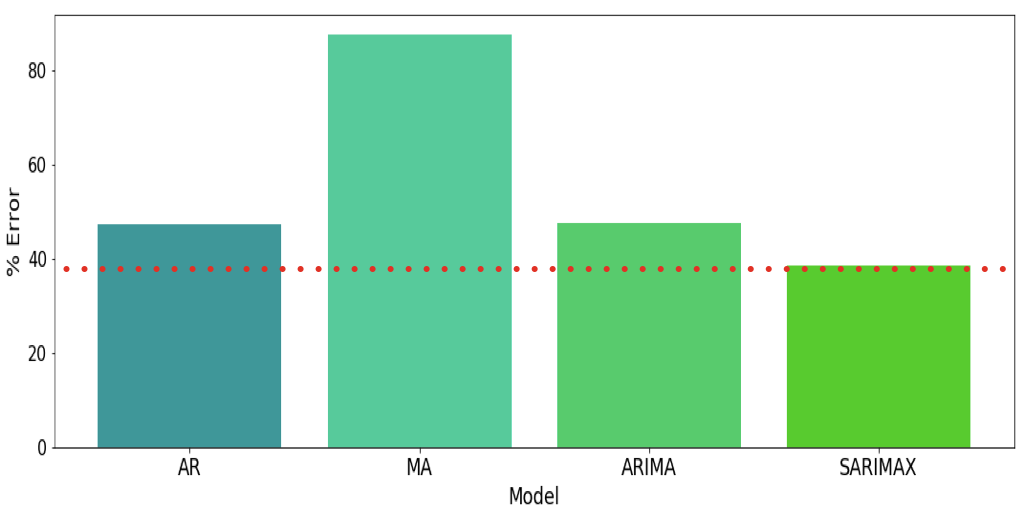
One of the most basic time series model is the autoregressive (AR) model, which predicts future values as the weighted sum of past values. For example, an AR-24 model assumes that the predicted values of tomorrow are the exact observed values of the last 24 hours. The AR-24 model trained on 3 months of energy consumption data returned a RMSE of 0.903 for a forecast of 10 days.
Moving average (MA) model is another basic approach to modeling univariate time series. It specifies that future values depend linearly on the current and previous white noise error terms. That moving average accounts for past error allows a smoothing of the model fit. MA-24 performed much poorly, especially for long forecasts of 10 days, with a RMSE of 1.667.
ARIMA
The better-performing time series models are typically a combination of several different models. Autoregressive integrated moving average (ARIMA) combines AR and MA with a differencing component, which stationarizes the model. The purpose of the three features is to make the model fit the data as well as possible. A non-seasonal ARIMA model is denoted as ARIMA(p,d,q), where p is the number of lags, d is the degree of differencing, and q is the order of the moving-average model.
Adding a seasonal component is another way to further refine the model for accurate forecasting. The seasonal component include its own three features. A seasonal ARIMA model is denoted as ARIMA(p,d,q)(P,D,Q)m, where m is the number of periods in each season, and P, D, Q refer to the autoregressive, differencing, and moving average terms of the seasonal component.
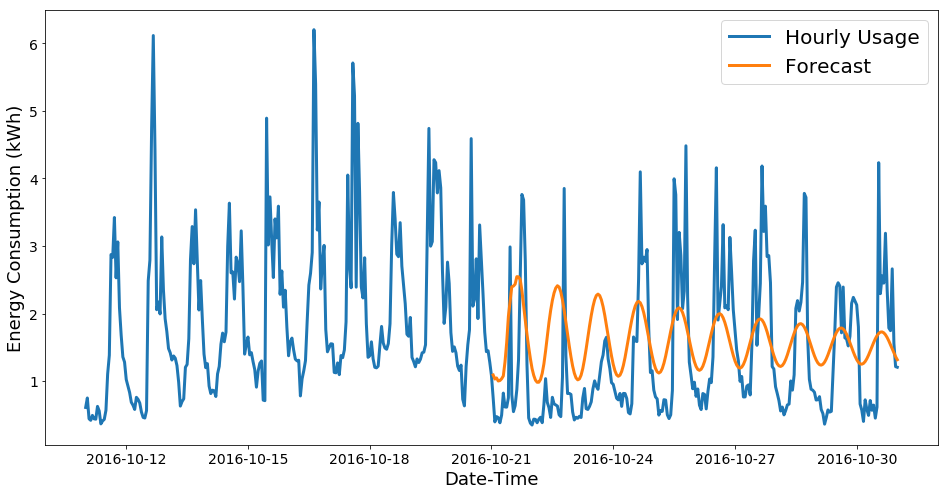
Following a Box-Jenkins approach, I optimized parameters with a model of ARIMA(1,0,1)(0,1,1)24. The seasonal component was based on seasons of 24 hours because energy consumption typically follows similar patterns on a daily basis. The ARIMA model performed decently with a RMSE of 0.904, but this was not an improvement over the baseline AR model. The forecast highlights the general shape and seasonality quite well, but does not account for the intensity of the peaks. The implication here is that there are external features that affect the dataset, so we can not build the model solely based on the time series.
ARIMA with Exogenous Variables
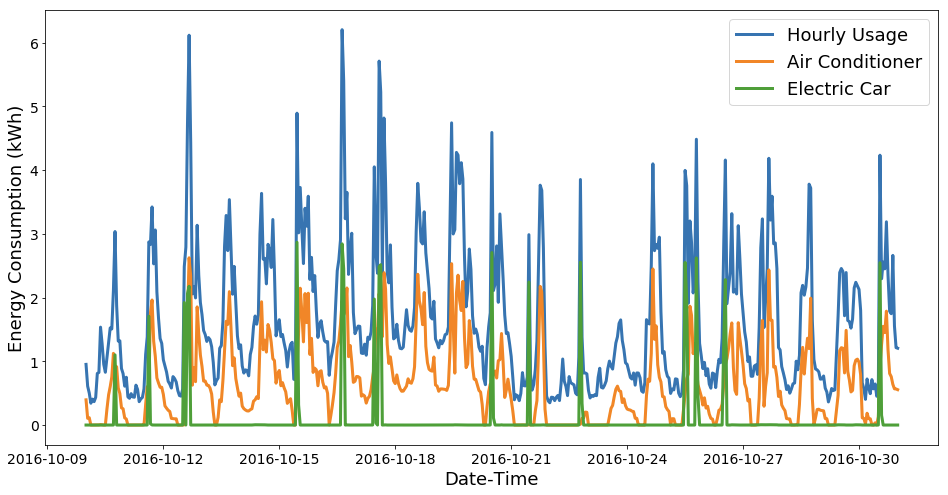
The Dataport includes various features, such as electric vehicle charging and air conditioner usage at the hourly level. These are exogenous variables whose values are independent from the states of other variables in the system. The plot of these appliance usage with the total energy usage shows that the appliances have a significant effect on the intensity of the peaks.
Appliance usage, weekends, and weather data, such as temperature and humidity, can be included to improve the ARIMA model fit. However, exogenous variables can only be included if the values of the variables at the forecasting times are known. Weekends are a fixed variable, so it is easy to include in the model. Individual ARIMA models had to be applied to every other exogenous variable in order to forecast the future values. The nature of car charging patterns made it difficult to fit an accurate ARIMA model, so I forecasted the values based on the average of past values at specific times.
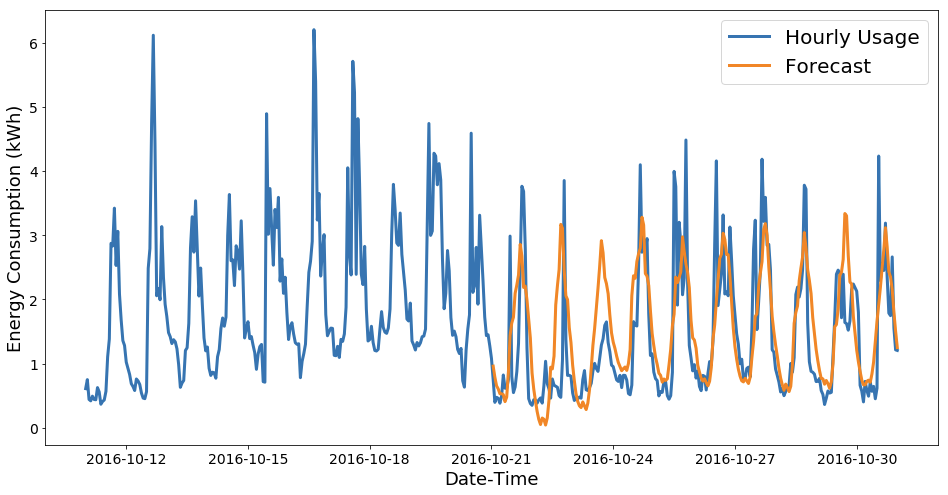
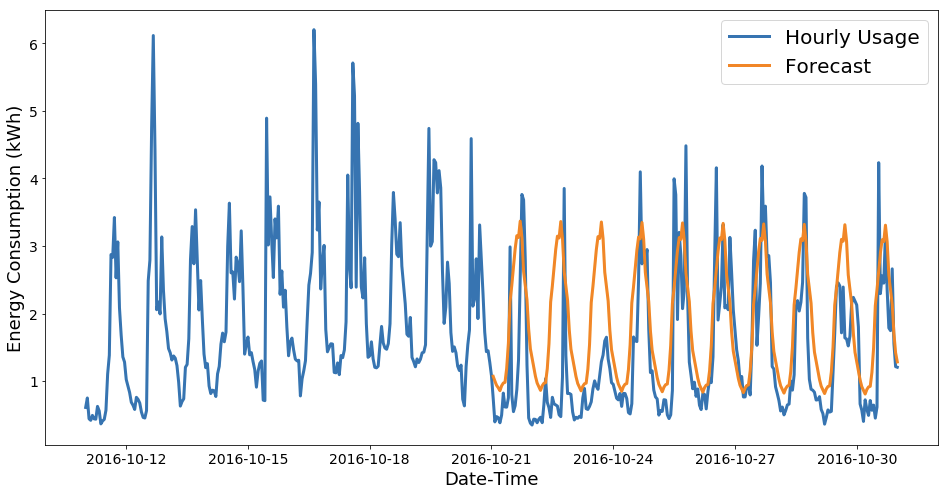
The result was a much improved ARIMA(1,0,1)(0,1,1)24 model with a RMSE of 0.732. This was the best performing model and did a much better job at highlighting the intensity of the peaks.
Dashboard:
The following is an interactive dashboard built using Plot.ly Dash application. This is a platform that is currently applied to just one building from the Dataport, but can ideally be scaled up to all buildings for real world business applications. The dashboard contains information on past month energy usage and costs as well as next month forecast based on the ARIMA model with exogenous variables. It also compares the performance of our building to similar neighbors, based on a random forest regression model using physical characteristics as features.
Carbon emission in metric tons was also added to inform users of the environmental effect of their energy consumption. This is coupled with the number of trees to plant and the number of LED lightbulbs to switch to from incandescent lightbulbs in order to offset the carbon emission. Positive recommendations can reinforce healthier energy consumption behaviors.
The past 3 months of energy consumption was plotted to show the progress over time. Based on this data, the ARIMA model with exogenous variables forecasted the next 10 days of energy consumption. This can not only help predict energy costs, but also identify the peak energy usage times.
With a general idea of the user’s energy consumption, it also helps to understand the exact appliances that strongly affected the performance. The exploratory data analysis of the appliances compares the user’s appliance usage to the average neighborhood usage. For more detailed hourly data, the dropdown of the specific appliance can be selected.
Next Steps:
The final ARIMA model with exogenous variables fit the data with minimal error, but can still be further improved. The current exogenous variables include electric vehicle charge, temperature, and humidity. Other significant appliances, such as air conditioner, should also be included to better forecast energy consumption.
The current dashboard provides a general layout for a platform to promote smart energy consumption. In order to extract the full business application of the dashboard, it should be integrated with real-time data of all buildings in the Dataport. This step will require a lot of data and processing power, but can potentially produce a product that can help users save money and create a safer and more sustainable planet.