Predicting Agriculture Yield with Weather
Background:
The global human population has been growing consistently and is expected to reach 9 billion by 2050. The average American consumes about 2000 pounds of food per year. Assuming these numbers hold true through 2050, there will be a significant increase in demand for food in the next few decades. Scientists have claimed that environmental degradation and variable weather conditions caused by climate change can potentially threaten the global food supply. In order to understand this relationship, the effect of different weather variables on crop yield is studied.
Data:
California agriculture data from USDA National Agricultural Statistics Service is studied in order to understand the crop yield in the nation’s largest agriculture industry. Weather data on Fresno, California is collected from Weather Underground in order to specify the county with the highest crop yield in the state. The data was scraped from the web using BeautifulSoup, Selenium, and Scrapy. With these two data sources, an appropriate study can be done to predict the effect of weather on crop yield for the rest of the US.
The dependent variable is crop yield measured in BU/acre. The independent variables of interest are weather variables, such as maximum temperature, mean temperature, minimum temperature, heating days, cooling days, growing days, dew point, precipitation, wind, and sea level pressure, as well as population and year. This study was done on two different field crops: corn and wheat.
Analysis:
The relationship between the independent and dependent variables were modeled using linear regression techniques. The initial model contains all independent variables with the results analyzed using statsmodels. Variables with p-values greater than 0.05 were removed in order to focus the model on only statistically significant variables. A new model with fewer variables was analyzed to observe the changes in significance of variables. A heat map of the correlation between the variables helped remove variables that had strong correlation and did not improve the model. Each linear regression model was cross validated with 5-folds to test its capability to accurately predict crop yield based on new inputs.
Once the optimal variables had been identified, regularization with an alpha value that minimized mean squared error was applied to build a model with minimal overfitting. Three different techniques of regularization were applied: Ridge, Lasso, and Elastic Net. The regularization technique with the highest R-squared value from cross validation was chosen as the final model.
Corn Yield
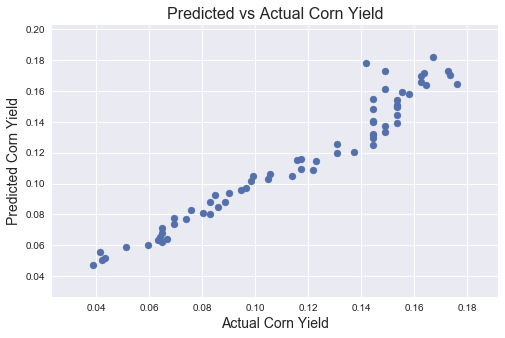
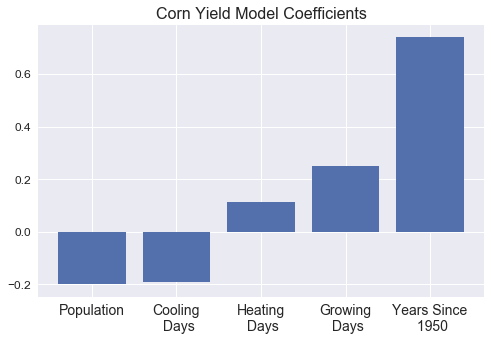
The initial highest scoring linear regression model with Ridge regularization (alpha = 1E-3) scored an R-squared of 0.944. Shown below is the plot of the model with years, growing days (>50ºF), heating days (<65ºF), cooling days (>65ºF), and population as the features. There is a very strong collinearity, which is primarily explained by years. The model coefficients show that this feature is significantly larger than the others. This suggests that demand for corn increased with the years since 1950, but the model does not properly show how weather can predict corn yield.
Removing these years and population helps us observe the best weather features to predict corn yield, which is the primary objective of this project. The best model using Ridge regularization (alpha = 1E-4) with precipitation and cooling days as the features is
corn_yield = -0.07 + 1.47(cooling_days) + 0.08(precipitation)
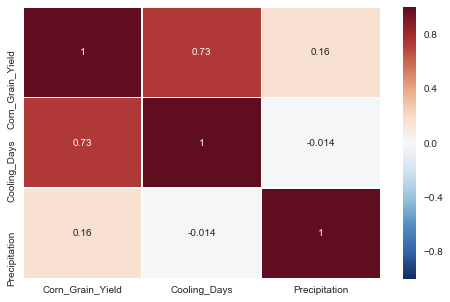
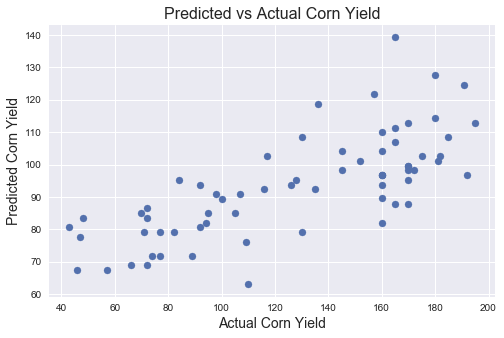
This model scored an R-squared value of 0.569, is which significantly lower than the initial score. The model coefficients show that cooling days is the primary predictor of corn yield. The heat map shows that corn yield has a strong correlation with cooling days, but a weak correlation with precipitation.
A plot of the relationship between predicted and actual corn yield shows a moderate correlation with some randomness. The implication here is that these two features are good predictors for corn yield without any significantly correlated feature that singlehandedly define the model.
Wheat Yield
Wheat yield can be predicted using three features with the model:
wheat_yield = 0.08 + 0.73(years_since_1950) + 0.35(mean_temperature) - 0.79*(dew_point)
This model scored an R-squared value of 0.537 using Ridge regularization (alpha = 1E-3). The scatter plots of the effects of each feature on the wheat yield show that there is a somewhat strong correlation for years since 1950. Mean temperature and dew point show more randomness, but still have a moderate correlation with wheat yield. Although years since 1950 appear to be the strongest predictor, that feature alone did not produce the best model.

Next Steps:
The strongest variable to predict crop yield for both corn and wheat is years since 1950. In terms of weather variables, cooling days and precipitation best predicted corn yield, and mean temperature and dew point best predicted wheat yield. It can be assumed that agricultural policy plays a significant role in the production of crops in order to componsate for the growing population in the world. A more in-depth analysis with wider variety of crops and regions can provide a better understanding of how weather affects crop yield.
